

Uranium: Part 2
Don’t Forget to Subscribe by Scrolling to the Bottom of this Article
I am continuing my series on the Uranium sector which I remain bullish on over the next 3-5 years. This week I’m going to be discussing the supply side of things, as we kind of did an overview of the sentiment and demand side of the equation last week. The end of the series will come in part 3, but I will continue to discuss some Uranium exposed companies that I am keeping my eye on. Also, I am playing around with what time/day seems to get the best interaction, so expect zero consistency on my side as far as posting goes. I will try to keep a steady stream of content so everyone can understand my thoughts and logical breakdown process.
Before I start, I have paid attention to the comments and I would like to clarify something. The case I am building is over the next 3-5 years, we have already seen some of the effects of the things I am describing but even if I am not right next year, I will be unbothered. If you expect short term appreciation on any of my articles, I believe you may be reading the wrong blog.
Uranium Part 2: State of Supply
So, lets start getting into the supply side of the things, which will be the main piece of this article. In this part, I will merely discuss the state of supply, I am not talking about the process itself (this will come in Part 3), but how current prices have been shaped by the long term supply and demand of the past. To understand Uranium, it is key that we see the association between the nuclear energy trends discussed in Part 1 and the price of Uranium itself, as can be seen in the below Uranium price chart:

Historical Uranium Prices, XTB
You can see in the above price charts that Uranium experienced a manic bubble in the early 2000s and skyrocketed alongside oil prices in 2007. This led to an oversupply, especially with the entry of Kazakhstan as the world’s largest Uranium producer, (combined with continuous waning demand) that led to a decades-long decline in Uranium prices. This is currently the mindset that many investors operate on when they think of the uranium industry. Most Uranium bulls in the early 2010s could not comprehend the effect that Kazakhstan had and that industry sentiment would not lead to any new surprises leading to many calling for bull markets that never came. The supply side of things finally start to get out of control when Uranium dropped near $20 (less than half of the needed amount to encourage production) in 2017 leading to the first innings of the uranium bull market that we are currently experiencing.
Where is the production coming from?
The Uranium industry only relies on a few countries for the bulk of global supply. Kazakhstan, Canada, and Australia combine for 75% of the world’s uranium supply, and this is where most of our major producers reside. The global market share of mining companies can be seen in the graph below.

From Statista, https://www.statista.com/statistics/242040/largest-uranium-mining-companies-worldwide/
The industry operates in long term contracts. This has likely caused issues for supply far down the line. I estimate that marginal cost of production is between $60-$80 over the next 2-3 years and will most likely grow as inflation around the world increases the prices of most inputs. Around 2019, the marginal cost of production was around $40-$60 per pound and obviously that number has increased considerably.
Spot Price
Let’s look at the below uranium spot price graph to understand the long-term structural issues that are being created:

Uranium Spot Price
In the above chart, you can see that Uranium has not been at replacement levels in at least 5 years. This indicates that supply is not being adequately replaced. Even if the Uranium prices double, we still aren’t at replacement levels. This is creating long term structural damage to the industry. Look at this comment from Cameco’s Q3 2022 transcript regarding the state of the industry:

Cameco Earnings Transcript
Due to most of the supply being caught up in long term price contracts, the spot market pricing is dependent on producers who rely on long term contracts, as well as utility companies filling left over needs.

Gray is long term contract prices and blue is spot prices. As you can see they have converged. From cameco website.
As you can see the spot supply market is much thinner than has historically (since 2007) been the norm, and this can be explained by the tight spread seen in long term contracts vs short term contracts (as shown in the above graph). What else does this pricing and implied thin spot market tell us? It’s telling us that producing is so expensive that producers are literally buying and selling the spot prices over producing their own uranium, leading to a price that is no longer worth it to buy in the spot market. This has long term consequences, as it shows that producers really have no wiggle room to squeeze out more uranium putting extreme pressure on prices. Now, if there is zero gap between spot price and long-term prices, this means there is zero room for error from producers. If producers miss production, they will now have to start buying spot price uranium whether they like to or not. This could, and probably will, cause the spot price of uranium to start experiencing a price higher than long term price contracts, (hence encouraging higher priced long-term contracts). This also implies that the stockpiles that consumers tend to hold are also beginning to wear thin and don’t have much time (this is relative though, could be 6 months or it could be 2 years) of inventory left.
SPUT
Another vehicle that is helping increase this thinning of spot Uranium is SPUT (Sprott Physical Uranium Trust). SPUT has been buying spot uranium like mad men (see chart below), which I believe has helped in the tightening of Uranium spot price supply, as they have basically tripled their Uranium holdings in about 2 years, becoming the world’s largest holder of uranium.

Sprott Uranium in Reserve
SPUT will not be selling this uranium supply and it is now completely off the market (their mass buying happens to coincide with current Uranium price movement), and yellow cake operates similarly with a holding around 18 million pounds. The thing with SPUT, is that if investors feel that prices of uranium are going up and start piling in leading to a NAV increase, this causes SPUT to start rapid buying uranium. If uranium is no longer available on the spot market this will cause a rapid increase in uranium prices from a vehicle that has not been used in previous cycles. This negative feedback cycle could easily push things out of hand for uranium prices, that are operating on a very thin spot market.
Utility Companies
Utility companies are showing strain in their inventory as of May of last year, putting further pressure on spot prices. See the below slides, from Adrienne Hanly of the IAEA, describing the situation for utilities in both Europe and the US.

From the IAEA describing US utility environment
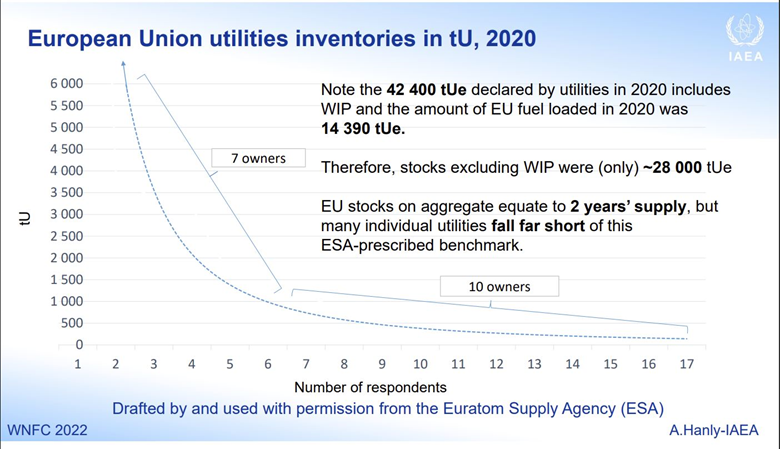
From the IAEA describing European utility environment
As utility companies are one of the biggest buyers of spot priced uranium, this will be extremely straining on them. Even though the department of energy has some reserves this will still cause a massive spike in prices if things keep going the direction that they are (although prices have increased since May of last year).
If the strain on uranium supply gets squeezed this will effect long term contracts which is where the real money is for most producers. And with that I will let you guys sit on this, until Part 3. In Part 3, I will discuss what my expectations of the future are, and I’ll also discuss how the enrichment process works. If Part 3 becomes too long (it’s already the longest part), I will turn this series into a 4 part series.
Disclaimer: The author of this idea has a position in securities discussed at the time of posting and may trade in and out of this position without informing the reader.
Opinions expressed herein by the author are not an investment recommendation and are not meant to be relied upon in investment decisions. The author is not acting in an investment adviser capacity. This is not an investment research report. The author's opinions expressed herein address only select aspects of potential investment in securities of the companies mentioned and cannot be a substitute for comprehensive investment analysis. Any analysis presented herein is illustrative in nature, limited in scope, based on an incomplete set of information, and has limitations to its accuracy. The author recommends that potential and existing investors conduct thorough investment research of their own, including detailed review of the companies' SEC and CSA filings, and consult a qualified investment adviser. The information upon which this material is based was obtained from sources believed to be reliable, but has not been independently verified. Therefore, the author cannot guarantee its accuracy. Any opinions or estimates constitute the author's best judgment as of the date of publication and are subject to change without notice. The author and funds the author advises may buy or sell shares without any further notice.
This article may contain certain opinions and “forward-looking statements,” which may be identified by the use of such words as “believe,” “expect,” “anticipate,” “should,” “planned,” “estimated,” “potential,” “outlook,” “forecast,” “plan” and other similar terms. All such opinions and forward-looking statements are conditional and are subject to various factors, including, without limitation, general and local economic conditions, changing levels of competition within certain industries and markets, changes in legislation or regulation, and other economic, competitive, governmental, regulatory and technological factors, any or all of which could cause actual results to differ materially from projected results.